Call us now :07313725949

 Send Inquiry
Oscillating Disc Rheometer
MOQ : 1 Unit
Oscillating Disc Rheometer Specification
- Features
- High Sensitivity, Robust Construction, Programmable Testing, Emergency Stop
- Speed Range
- 0.1 to 100 rpm
- Control Type
- Microprocessor Controlled
- Display Type
- Digital LCD
- Heating Capacity
- Up to 200C
- Shape
- Rectangular
- Accuracy
- 0.1 Nm
- Temperature Resistance
- Up to 200C
- Power Supply
- Electrical
- Usage
- Laboratory & Industrial
- Type
- Oscillating Disc Rheometer
- Dimension (L*W*H)
- Approx. 780 mm x 645 mm x 400 mm
- Product Type
- Oscillating Rheometer
- Equipment Materials
- High-grade Steel Alloy
- Power
- 220-240 V, 50/60 Hz, Single Phase
- Voltage
- As per required Volt (v)
- Application
- Laboratory & Industrial
- Warranty
- Yes
- Test Chamber Diameter
- 176 mm
- Calibration
- Factory Calibrated with Options for User Calibration
- Test Frequency
- 0.01 Hz to 10 Hz
- Ambient Temperature Range
- 10C to 40C
- Testing Modes
- Automated & Manual
- Sample Loading Capacity
- Single/Double Test Specimen
- Weight
- Approx. 70 kg
- Torque Measurement Range
- 0-10 Nm
- Color
- Industrial Grey
- Compliance
- ASTM D2084, ISO 6502
- Data Output
- USB and RS232
- Operating System
- Windows-Compatible Control Software
- Safety
- Overload Protection, Automatic Shutdown
Oscillating Disc Rheometer Trade Information
- Minimum Order Quantity
- 1 Unit
- Payment Terms
- Cash Advance (CA), Cash in Advance (CID), Letter of Credit at Sight (Sight L/C), Telegraphic Transfer (T/T), Letter of Credit (L/C)
- Supply Ability
- 3 Units Per Month
- Delivery Time
- 6 Week
- Main Export Market(s)
- Asia, Australia, Central America, North America, South America, Eastern Europe, Western Europe, Middle East, Africa
- Main Domestic Market
- All India
About Oscillating Disc Rheometer
Oscillating Disc Rheometer shows a typical Cure Curve obtained in the software test screen. The curve of Torque V/s Cure Time depicts all the vulcanization characteristics of the Rubber Compound and that can be determined directly. XY Plot of Torque (F) against real cure time is called Rheometer graph. Rheometer graph is displayed in real time and at the end of test time, software and displayed on the screen.Precision & Reliability for Material Analysis
Engineered for rigorous laboratory and industrial applications, this Oscillating Disc Rheometer delivers precise torque measurements and programmable testing capabilities. The digital LCD interface and microprocessor controls facilitate easy operation and improved repeatability, ensuring dependable test results for rubber, polymers, and elastomers. Compliance with ASTM D2084 and ISO 6502 guarantees industry-standard performance.
Advanced Safety & User-Focused Design
The rheometer is equipped with advanced safety mechanisms such as overload protection, automatic shutdown, and an emergency stop, ensuring operator security during every test. The sturdy steel alloy build minimizes vibrations, while the devices compact rectangular shape (780 mm x 645 mm x 400 mm) fits seamlessly into modern laboratories or industrial facilities.
Flexible Operation and Data Management
With both automated and manual test modes plus USB and RS232 data outputs, this rheometer adapts effortlessly to varying laboratory protocols. Programmable testing features and Windows-compatible software deliver efficient data processing, seamless integration, and easy sharing or archiving of test results.
FAQs of Oscillating Disc Rheometer:
Q: How does the Oscillating Disc Rheometer ensure accurate measurements for my rubber compounds?
A: This rheometer uses high-sensitivity sensors, precise torque measurement (010 Nm, 0.1 Nm accuracy), and microprocessor control to deliver reliable results. Its factory calibration with user calibration options allows you to maintain accuracy for your specific testing protocols.Q: What types of test specimens can this device accommodate?
A: The rheometer supports both single and double test specimen configurations, making it adaptable for various research and quality control requirements in laboratories and industrial settings.Q: When should calibration be performed on the rheometer?
A: The instrument is factory calibrated, but user calibration can be performed as neededsuch as after significant relocation, mechanical adjustments, or periodically in line with your quality assurance protocols to maintain measurement accuracy.Q: Where can I use the Oscillating Disc Rheometer?
A: This device is designed for both laboratory and industrial environments. Its robust construction and broad temperature resistance make it suitable for diverse settings requiring precise elastomer testing, such as quality control labs or production facilities.Q: What is the process of conducting a test using this rheometer?
A: Begin by loading a single or double sample into the 176 mm test chamber. Choose automated or manual testing mode, set your testing parameters on the Windows-compatible software, and start the test. The results display on the digital LCD and can be exported via USB or RS232.Q: How does the Oscillating Disc Rheometer benefit laboratory workflows?
A: Its programmable, automated testing modes, high sensitivity, fast data output, and safety features minimize errors, maximize productivity, and streamline the analysis of rubber or elastomer properties for research and production control.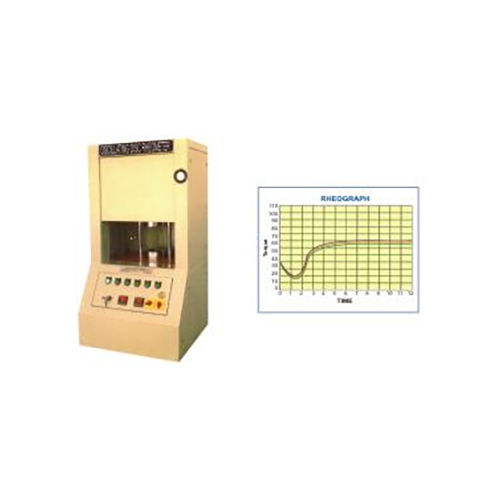
Tell us about your requirement

Price:
Quantity
Select Unit
- 50
- 100
- 200
- 250
- 500
- 1000+
Additional detail
Mobile number
Email

Our Products
- Testing Machines
- Metallography Machines
- Mooney Viscometer
- Metallurgical Microscope
- Metallography Kit
- Garnet Sand
- Heat Treatment Furnace
- Submersible Agitator
- Escr Apparatus
- Oscillating Disc Rheometer
- Universal Testing Machines
- Hardness Testing Machine
- Rubber And Plastic Testing Equipment
- Laboratory Equipments
- Impact Testing Machine
- Moving Die Rheometer
- Coating Thickness Gauge
- Hot Air Oven
- Industrial Agitator
- Industrial Furnace
- Cast Iron Mould
- Hardenability Set Up
- Digital Brinell Microscope
- Humidity Chamber
- Grinding Polishing Machine
- Rebar Detection Meter
- Industrial Moulds


No Flat No. 4, Vidiansu Villa, Plot No. 73, Sangam Nagar Society, Pune Satara Road, Pune - 411037, Maharashtra, India

Mr Mahesh Deshpande
(Director)
Mobile :07313725949
 Send Inquiry
 Send SMS
Developed and Managed by Infocom Network Private Limited.
